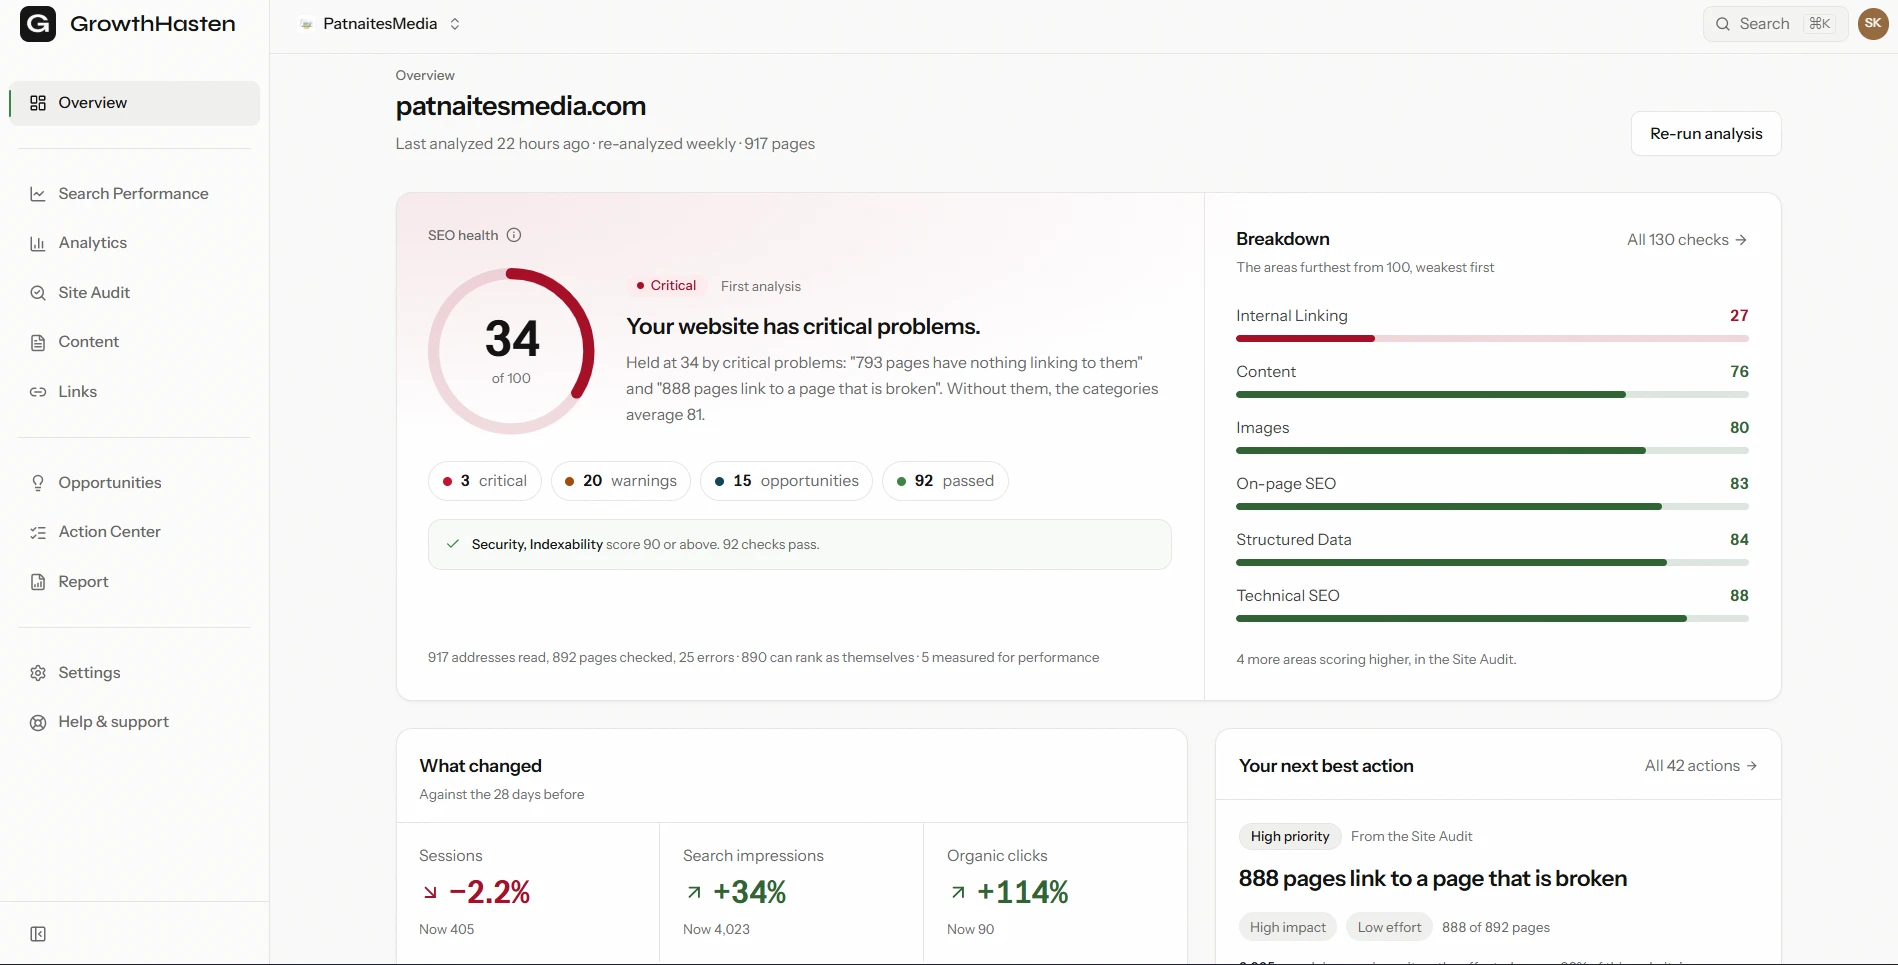


An SEO dashboard is a standing view that pulls your recurring search metrics into one place, so nobody rebuilds the same charts at the start of every month. It is not a report, and treating it as one is where most of them go wrong. This guide is for the person who has to defend those numbers upward, to a founder, a board, or a client asking what changed and why. It covers the four tiers of tile that earn a place on a dashboard, the five metrics that quietly mislead on one, and why your two main data sources will never agree with each other.
The short version
- A dashboard is not a small report. The dashboard holds the recurring numbers; the report holds the judgment. Build one artifact to do both jobs and you end up with a document nobody reads attached to an instrument nobody trusts.
- Every tile needs a stated job. If you cannot name the question a tile answers and the person who asks it, the tile is decoration, and it is spending attention that the tiles beside it need.
- Five common metrics actively mislead on a dashboard. Site-wide average position is the worst offender: start ranking for one new long-tail query at position 40 and the tile gets worse while the business gets better.
- The build tool matters far less than the tier structure. Looker Studio, a spreadsheet, and a paid platform will all hold the same tiles equally well.
- Search Console and GA4 will never reconcile. A dashboard that puts them side by side without labeling the difference manufactures the same argument every month.
What is an SEO dashboard, and what separates it from an SEO report?
One is a standing instrument, the other is a periodic narrative. The dashboard is always on and always current, and it answers the question "what are the numbers". The report is written on a cadence, and it answers "what happened, what does it mean, and what are we doing next".
That distinction sounds academic until you watch a team try to build a single artifact that does both. The dashboard grows commentary boxes that go stale within a week. The report grows chart appendices nobody scrolls to. Both jobs get done badly.
| Question | The dashboard | The monthly report |
|---|---|---|
| Who is it for? | Anyone who wants a number between reports | The person who has to make a decision |
| What does it hold? | Recurring metrics, always current | Interpretation, cause, and the next move |
| How often does it change? | Automatically, on a data refresh | Deliberately, when someone writes it |
| What breaks it? | A tile whose question nobody can name | Numbers with no judgment attached |
The two are complementary, not competing. Build the dashboard so the recurring numbers stop consuming anyone's time, then spend that time on the monthly report that turns these numbers into decisions. This article is about the first half of that split.
What belongs on an SEO dashboard?
There are four tiers, and the order they come in matters. The order mirrors how a search program actually fails: visibility problems surface first, engagement problems next, technical problems underneath both, and outcome problems last of all.
Tier 1, visibility: is search putting us in front of more of the right people than it was last month?
Tier 2, engagement: did the people who arrived do anything once they got here?
Tier 3, technical health: is anything structural stopping pages from being eligible in the first place?
Tier 4, business outcome: did any of it produce something the business counts?
| Tier | Tile | The question this tile answers |
|---|---|---|
| Visibility | Non-branded impressions | Are we being shown for more of the searches we do not already own? |
| Visibility | Non-branded clicks | Is that visibility turning into visits? |
| Visibility | Non-branded click-through rate | When we appear, do people choose us? |
| Visibility | Pages earning their first impressions | Is new work entering the index and getting shown? |
| Engagement | Organic sessions | How many visits did search actually deliver? |
| Engagement | Organic engagement rate | Did those visits go anywhere, or stop at the entry page? |
| Engagement | Organic sessions by landing page | Which pages are carrying the traffic? |
| Technical health | Indexed pages against submitted pages | Is Google keeping what we published? |
| Technical health | Pages with coverage errors | Is anything newly excluded that should not be? |
| Technical health | Core Web Vitals status by URL group | Is page experience degrading anywhere? |
| Business outcome | Key events from organic | Did search produce something we count as a result? |
| Business outcome | Key events by landing page | Which pages produce results, not just visits? |
Twelve tiles is a working ceiling, not a rule. The real test is the one in the second bullet at the top: for each tile, name the question and name the person who asks it. Anything that survives both, keep.
One note on the outcome tier, because it is the one most often left half-built. A key event in GA4 is not automatic. Google's documentation on key events is explicit that you "create or identify an event that measures the action and then mark the event as a key event", so an organic conversion tile on a property where nothing has been marked will render a confident, permanent zero. Check that before you build the tile, not after somebody asks why it is empty.
Which metrics should you leave off?
Five, and every one of them ships on dashboards that vendors hand out as templates. These are not weak metrics. They are metrics that mislead specifically in the dashboard context, where a number sits alone with no analyst standing next to it.
1. Site-wide average position: Google defines the position value in Search Console as "the topmost position occupied by a link to your property or page in search results, averaged across all queries in which your property appeared", which its documentation on impressions, position, and clicks sets out in full. A single number for the whole site is therefore an average across every query you appear for, including thousands you have never cared about. Start ranking for a new long-tail query at position 40 and the tile gets worse while the business gets better. The metric is fine at query level, where you can see which position moved and for what. It is the aggregation that lies, and a dashboard is precisely where aggregation happens by default.
2. Raw impressions with no branded split: an impression is recorded when "a user has seen (or potentially seen) a link to your site", which puts brand demand and search performance into the same number. A funding announcement, a product launch, or a competitor's outage moves branded impressions, and an undifferentiated tile reports that as SEO working.
There is a second problem underneath it. Rising impressions with flat sessions has at least two causes the tile cannot separate: a click-through or intent-match problem on the pages themselves, or a change in where those impressions are being served, since a link shown inside an AI-generated answer can be seen without ever being clicked. Split branded from non-branded with a query filter before this becomes a tile at all.
3. Bounce rate: GA4 defines it as "the percentage of sessions that were not engaged", the exact inverse of engagement rate, where GA4 counts a session as engaged when it meets any one of three criteria: more than ten seconds of duration, at least one key event, or at least two page or screen views. That is a defensible measure. It is simply not the measure the label implies to anyone who learned the term in the previous version of Analytics, where a bounce meant a single-page session that triggered one request to the server. In my experience, this is the tile that causes the most confusion in a stakeholder review, because the name survived a definition change that the metric underneath it did not. Show engagement rate as Google defines it, and label it engagement rate.
4. Keyword rankings with no traffic beside them: a rank tracker will cheerfully show two hundred keywords moving. Without clicks next to each one, there is no way to tell which of those movements mattered. Position 4 to position 2 on a query almost nobody searches is a green arrow that means nothing, and it will be the green arrow someone screenshots. Pair every ranking tile with the clicks that query actually produced, or leave rankings in the rank tracker where they belong.
5. Share of voice with an undefined denominator: a share-of-voice tile is a percentage, and a percentage says nothing until someone can state what it is a share of. Which keyword set, which competitors, weighted by volume or not. Two tools will hand you two different numbers for the same site on the same day, because they are dividing by different things. Work out how to define a share-of-voice denominator before it becomes a tile, then write that definition on the dashboard beside it, so the next person does not have to reconstruct it.
Which numbers go on the board slide instead?
Three, and they are not the same three as the dashboard's twelve. A board wants the smallest set of numbers that describes whether the channel is working; a dashboard holds the diagnostic set you reach for when one of those three moves. The selection logic for the short set, including how it should change as a site matures, belongs to our guide to which three numbers belong on a board slide. The dashboard's job starts where the board slide's ends.
Where does each tile's data come from?
Every tile above traces back to exactly one of four sources. Search Console supplies the search side: impressions, clicks, click-through rate, position, and index coverage. GA4 supplies the site side: sessions, engagement, and key events. A rank tracker supplies query-level position for the specific terms you chose to watch. Crawl data supplies the structural checks neither Google product surfaces on its own. The last two sit behind the dashboard rather than on it, which is why no tile in the table above draws on them.
Keeping the sources straight matters more than it sounds, because it decides which tiles can sit next to each other. Our guides to where the search-side data comes from and how to connect GA4 and Search Console into one report cover the setup, so this section will not repeat it.
One constraint is worth knowing before you design the layout rather than after. Google's documentation on the Search Console integration states that Search Console metrics inside Analytics "are only compatible with Search Console dimensions and the following Analytics dimensions: Landing page, Device, Country". A tile that tries to break Search Console clicks out by a GA4 dimension such as session source will not build. Design around that boundary instead of spending an afternoon fighting it.
Why do Search Console clicks and GA4 sessions never match?
Because they count two different events, and both definitions are public. The Search Console documentation linked above states that for most result types, a click is counted when it "sends the user to a page outside of Google Search, Discover, or News". Google's documentation on GA4 sessions states that a session initiates "when a user either opens your app in the foreground or views a page or screen and no session is currently active", and that a session_start event is collected once that has happened.
Read those side by side and the gap stops being mysterious. One measures a departure from Google. The other measures an arrival on the site. Different populations, and no amount of configuration will make them equal.
During our reporting setups, this is the most reliable source of a recurring monthly argument, and it is almost always rediscovered from scratch by whoever happens to be looking at the dashboard that week. The fix is not technical. Put the two numbers in separate sections rather than adjacent tiles, and add one line of static text underneath saying that Search Console counts clicks out of Google while GA4 counts sessions on the site, and that the two are expected to differ. A sentence of permanent label saves the same conversation twelve times a year.
Do you need Looker Studio to build one?
No. Looker Studio is free and connects to Search Console and GA4 without setup work, which makes it the common default rather than the required answer. A spreadsheet with scheduled exports will hold the same twelve tiles. So will a paid platform, if you already pay for one.
Three capabilities decide whether a builder is adequate, and they are the same three whatever the logo says:
- Join two sources: if search-side and site-side data cannot live on one canvas, you have two dashboards and a manual reconciliation step between them.
- Hold a consistent date range: every tile must answer to one control, or two people reading the same screen are reading different periods.
- Segment: without a branded and non-branded split, you are stuck with the raw-impressions tile that exclusion two rules out.
Anything that does those three things will work. Tool choice is the least consequential decision in this entire article, which is exactly why it absorbs the most debate.
How often should an SEO dashboard update, and who should see it?
Less often than people expect, and to a narrower audience than people assume. A daily refresh is almost always wrong for organic search, because the underlying data does not arrive that fast and the decisions do not get made that fast either. The integration documentation quoted above also states that Search Console data is available "48 hours after it is collected by Search Console", so a dashboard advertising today's number is showing a stale one under a fresh label.
Weekly is a reasonable refresh for most programs. Monthly is the honest cadence for anything in the outcome tier, where the sample sizes are usually small enough that weekly movement is mostly noise.
Audience is the second half of the question, and it changes what the instrument holds:
- Internal dashboards: keep all four tiers, including the technical health tier that only the practitioner acts on. Coverage errors and Core Web Vitals belong here and nowhere else.
- Client-facing and executive dashboards: drop tier three entirely, keep the definitions visible, and be careful with any tile a reader could misread alone. Every metric on a shared screen is a metric you will be asked to explain without warning.
That trade-off cuts against transparency instincts, so it is worth stating plainly. A stripped client dashboard is not hiding anything. It is declining to ship numbers whose interpretation depends on context that is not on the screen, and if that context matters, it belongs in the written report. GrowthHasten's Reports follow the same rule: every section is tagged Measured, Computed, AI-written or Not measured, so the context travels with the number.
What are the most common SEO dashboard mistakes?
Tile sprawl: the dashboard grows every time somebody asks a question, and nothing is ever removed. Additions are cheap, deletions feel political, and the instrument gets steadily less readable while nobody notices.
No default date range: two people open the same dashboard, one on 7 days and one on 28, and they disagree about reality for twenty minutes. Set a default and show it on the screen.
No segmentation at all: without branded separated from non-branded, and organic separated from everything else, most tiles are measuring the company rather than the channel.
Vanity tiles nobody acts on: total keywords tracked, total pages published, total backlinks. These make the work look busy and answer no question anyone actually has.
Redesigning it every quarter: this is the expensive one. A dashboard rebuilt twice a year has no comparable history, so nobody can separate a real trend from a definition change. The instrument only becomes useful once it has been boring for a while.
Never checking the connectors: a broken data source often renders as a flat line rather than as an error. Flat reads as stable, stable reads as fine, and the dashboard quietly stops being true. Open one raw source directly each month and confirm it agrees with the tile.
The habit worth building
Leave the dashboard alone. That is the discipline, and it is harder than building one. A dashboard you resist redesigning accumulates the one thing a new build cannot have, which is a long and consistent trend line, and a readable trend is what lets you tell a real change from noise. Every redesign resets that to zero.
The action for this week: open whatever you use now and go through it tile by tile. For each one, say out loud which question it answers and which person asks that question. Delete every tile that fails both halves, then check the five exclusions above against what is left.
Reports Where Every Figure Shows Its Source
GrowthHasten builds one document from your crawl, Search Console and Analytics, with what passed beside what failed and every section tagged Measured, Computed, AI-written or Not measured. Print it or save it as a PDF.
Explore ReportsQuestions
Frequently asked questions
What is an SEO dashboard?
A standing view that pulls your recurring search metrics into one place, so nobody rebuilds the same charts each month. It holds the numbers; it does not hold the interpretation. The judgment about what those numbers mean and what to do next belongs in a written report, which is a separate document with a separate job and a separate cadence.
Can ChatGPT create dashboards?
It can generate a layout, a query, or the configuration behind one, and several tools now connect an assistant directly to Search Console data. What it cannot do is decide which tiles deserve a place on yours. That is a judgment about which questions your stakeholders actually ask, and it is the part of the work that determines whether the dashboard gets used or ignored.
How many metrics should an SEO dashboard have?
More than a report and fewer than a tool's default template. A report should carry three to five numbers; a dashboard can hold the diagnostic set behind them, because that is where you look when one of those numbers moves. The working limit is not a count. It is whether you can name the question each tile answers and the person who asks it.
Why do my Search Console clicks and GA4 sessions never match?
They count different things. For most result types, Search Console counts a click that sends someone to a page outside Google Search, Discover, or News. GA4 initiates a session when someone views a page and no session is active, then records a session_start event. One measures a departure from Google, the other an arrival on the site. The gap is expected. Label it on the dashboard so it stops being rediscovered every month.
Do you need Looker Studio to build an SEO dashboard?
No. Looker Studio is free and connects to Search Console and GA4 without setup work, which makes it the common choice, but a spreadsheet or a paid platform will hold the same tiles. What matters is that the builder can join two sources, hold one consistent date range across every tile, and segment branded from non-branded traffic. Anything that does those three things will work.
Tags

Written by
GrowthHasten Team
Editorial Team, GrowthHasten
Articles from the GrowthHasten editorial team, grounded in primary research, our own testing, and what analyzing real websites shows, fact-checked in-house.
View profile