

Largest Contentful Paint, or LCP, times one thing: how long a visitor waits before the biggest piece of content on their screen finishes drawing. This guide is for the growth or marketing lead whose hero asset is the problem and who can fix it without shipping code, and for the engineer who picks up the ticket once the cheap fixes are gone. It covers which element the browser actually picks, the four sub-parts a slow paint breaks into, the three instruments for making a resource arrive early, and where to stop. The order matters more than any single fix: element, then budget, then owner.
The short version
- The browser picks the element, not you, and it can change its mind. Chrome reports a new candidate every time something larger paints, and stops the moment the visitor taps, scrolls or presses a key.
- A slow paint is four consecutive sub-parts, not one problem. They sum to your LCP, which is what makes them a budget you can allocate rather than a list of suspects.
- Text can be the element. When it is, resource load delay and resource load duration are both zero, and every image fix you were about to make does nothing.
fetchpriority,<link rel="preload">and eager loading are three different instruments. None of them helps a resource the browser has not discovered yet.- Good is
2.5sor less at the 75th percentile. The cheapest fix on a marketing site usually belongs to a designer, not a developer.
What does Largest Contentful Paint actually measure?
The render time of the largest content element visible in the viewport, counted from when the page starts loading. Not the full page load, not the last thing to arrive, and nothing below the fold. Google's web.dev reference on Largest Contentful Paint puts a good value at 2.5s or less and a poor one above 4.0s, taken at the 75th percentile of real loads, with mobile and desktop scored apart from each other.
Two consequences fall out of that definition.
Only the visible part counts: for images the reported size is the visible or the intrinsic size, whichever is smaller, and margins, padding and borders are ignored. A hero exported at 4000 pixels wide and cropped to a slim band is scored on the band.
Largest is not the same as important: the metric has no opinion about whether what it timed is what your visitor came for. It measures area.
For the three-metric system, the thresholds side by side and the general field-versus-lab split, start with our guide to the three Core Web Vitals and their thresholds. Everything below is LCP only.
Which element does the browser actually pick?
Whichever candidate paints largest, recalculated on every frame until the visitor interacts. That is the question a diagnosis tends to reach too late, and reaching it late is how a team spends a sprint compressing an image the browser was never timing.
The candidate set is short and specific: <img> elements, <image> inside an <svg>, <video> through its poster or first frame, an element carrying a background image loaded with the CSS url() function, and block-level elements containing text. A CSS gradient is not a candidate. Neither is anything the visitor cannot see.
Then it changes its mind. The browser fires a performance entry naming the largest contentful element as soon as the first frame paints, and another every time a larger one appears. Reporting stops when the visitor taps, scrolls or presses a key. Your LCP is the last candidate reported before that happened, which is why a page can time its logo at 400 milliseconds, its headline at 900 and its hero at 2.8 seconds and be scored only on the last one.
Based on my experience, the element a team names in a meeting and the element Chrome reports differ often enough that confirming it first is worth the two minutes it costs. Three places will tell you:
- PageSpeed Insights: the Lighthouse diagnostics name the element for that lab run and show the sub-part breakdown underneath. Fastest answer, one synthetic visitor.
- The Chrome DevTools Performance panel: record a load and read the LCP entry, which gives you the node plus local and field timings together. Use this when you need to point at the element in the DOM.
- The
web-vitalslibrary, attribution build: the only one that names the element your real visitors saw, with their sub-part timings alongside it. More setup, and the only answer describing your actual traffic.
Confirm on mobile separately, because the viewport decides the candidate and the two layouts often disagree about which element is largest.
What are the four sub-parts of a slow paint?
Time to first byte, resource load delay, resource load duration and element render delay. They run consecutively and they add up to your LCP, which is what turns them into a budget rather than a list of causes. Google's web.dev guide to optimizing LCP defines each one and publishes a target share for it.
| Sub-part | Target share | What a slow one looks like, and who owns it |
|---|---|---|
| Time to first byte | ~40% | The server is still thinking while the browser has no HTML to parse. Nothing downstream has started. Engineering and hosting: caching, a CDN, the render path. |
| Resource load delay | Under 10% | The HTML arrived and the browser waited before requesting the LCP resource. It had not found it yet. Engineering: a discovery problem in the markup, and the sub-part priority hints act on. |
| Resource load duration | ~40% | The request started on time and the file took too long. Too many bytes for the connection. Design and marketing own the source asset. Serve it in a modern format at the right size, which our image SEO guide covers. |
| Element render delay | Under 10% | The resource finished downloading and the element still did not appear. Something is blocking the paint. Engineering: render-blocking CSS and synchronous scripts in the <head>. |
Add the two large targets and roughly 80% of a healthy LCP is server time plus download time. That is what normal looks like, which is also what makes an abnormal split informative: a page whose bottleneck sits in delay or render has a structural problem rather than a heavy asset, and compression will not move it.
Writing all four down at once is the point. Individually they are diagnostics you can argue about. As a budget they force a subtraction, and the subtraction usually ends the argument: if time to first byte is 1.8 seconds of a 3.2 second LCP, the hero is not your problem however large it is. Treat the shares as guidance rather than a specification.
Is a Slow Paint Your Biggest Problem?
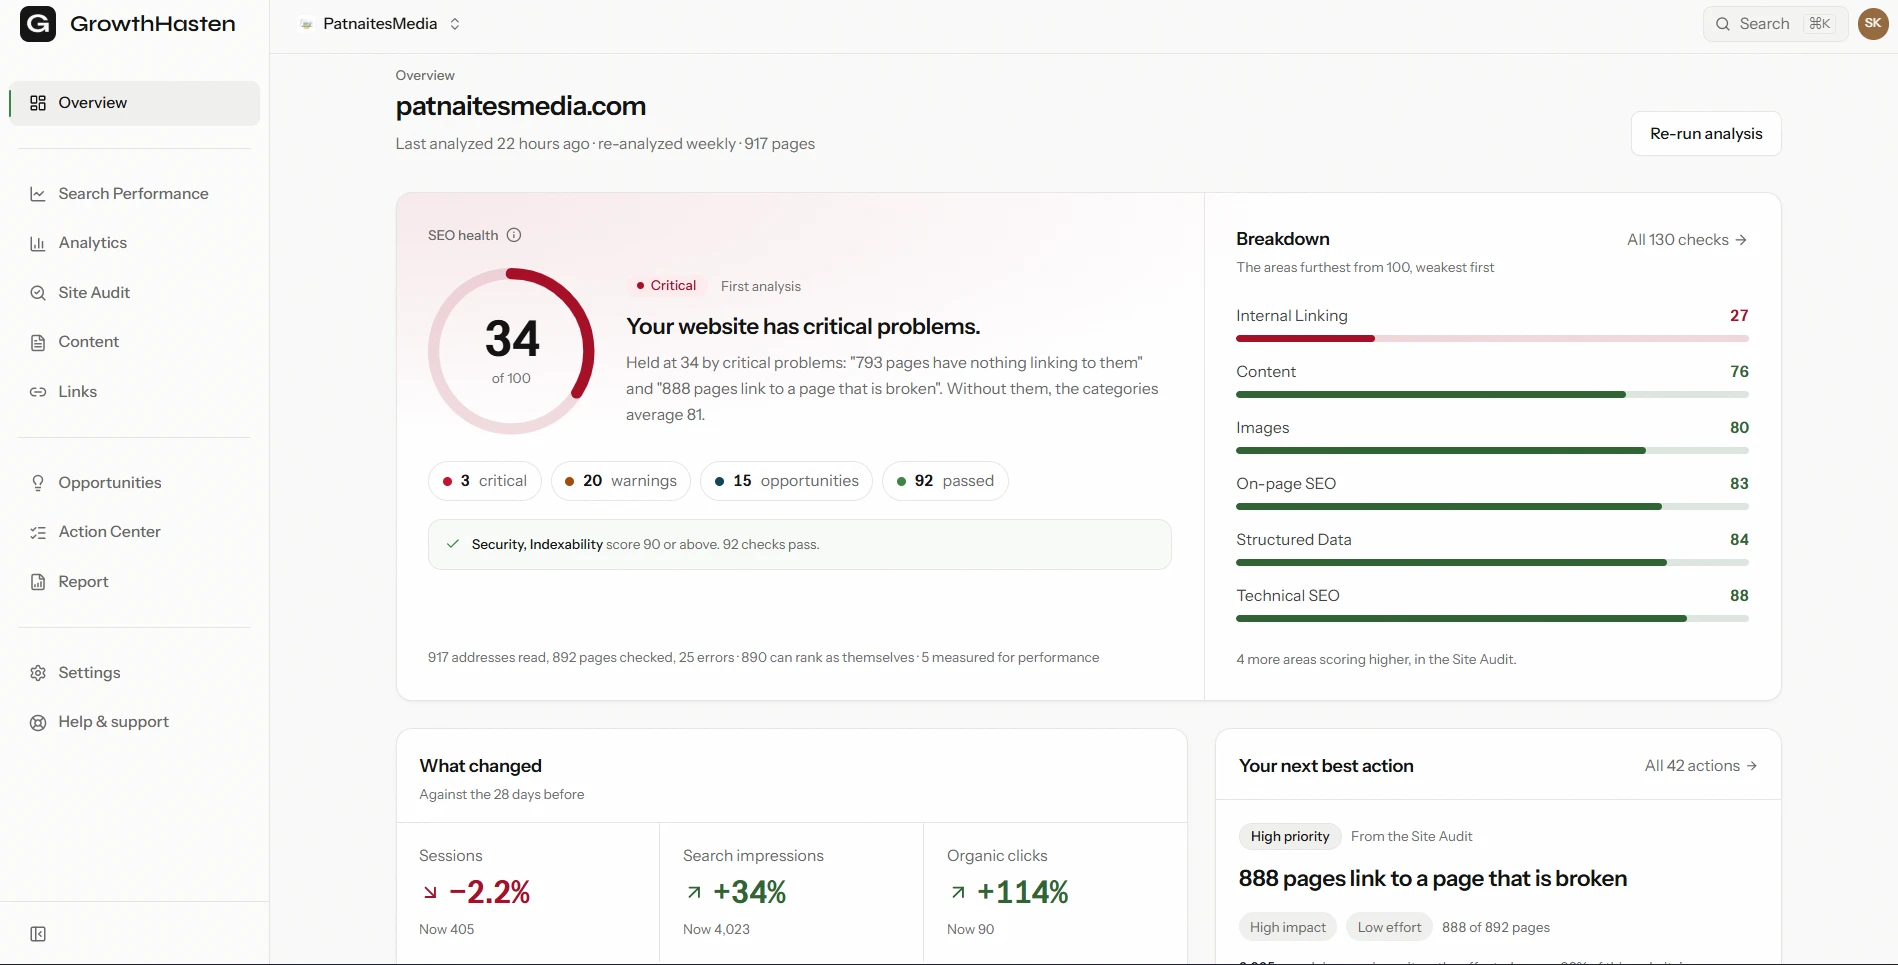
GrowthHasten's Site Audit crawls your site and ranks what to fix first across technical SEO, content and structured data, with Core Web Vitals measured over a sample of pages through PageSpeed Insights. Useful when a slow paint is competing with everything else for the same sprint.
Explore the Site AuditWhat can you fix without a deploy?
More than the ticket queue implies. The hero is an asset marketing tends to own end to end: a designer exports it, a marketer uploads it, growth swaps it for an experiment. Four common causes of a failing LCP therefore sit with people who have never opened the repository.
- The export nobody checked: a hero handed over at print dimensions and uploaded untouched. The browser downloads every one of those bytes, then draws it into a band a fraction of the size. Re-exporting at the width the layout uses is a design task.
- The hero video: an autoplaying clip is a far larger download than the poster frame it replaced, and the poster is what the metric times. If it exists to look expensive rather than to explain something, the honest test is whether removing it costs a single signup.
- The A/B-tested hero: a script that rewrites the hero after first paint gives the browser two paints to do and times the second. Decide the variant server-side, or accept that the test is comparing a slower page against a faster one and calling the gap a preference.
- The asset replaced through the CMS: a swap made in an admin panel skips whatever build step used to compress and resize the original. The page looks identical and the payload does not, which is why it survives undetected.
None of those four needs an engineer, and together they are why LCP is the most accessible of the three Core Web Vitals to a non-engineering owner. They matter most on conversion pages built around one big hero image or video, where the asset is the design and nobody expects it to be the defect. Exhaust them before filing anything.
What do you do when the element is an image?
Get it discovered, get it prioritized, and get it smaller, in that order. The first two are this article's subject and the next section covers the instruments for both. The third is a separate discipline with its own rules about formats, sizing and responsive sources, and our image SEO guide covers the image-specific fixes in full. One boundary case belongs here rather than there, because it is the most expensive single mistake available: loading="lazy" on the element the metric is timing defers the one request the whole measurement is waiting on, and web.dev's rule is blunt about it, never lazy-load the LCP image. If you are on Next.js, next/image with priority set covers the eager-load and priority-hint half of this for you.
What do you do when the element is text?
Two of the four sub-parts collapse to zero, and that simplifies the problem enormously. A text node needs no resource fetched, so resource load delay and resource load duration are both nothing, and your entire budget is time to first byte plus element render delay. There is no image to compress, which is exactly where a diagnosis tends to stall.
Three things cause almost all of it.
The server is slow: with no resource in the middle, TTFB is most of your LCP by construction. Caching, a CDN and a cheaper render path are the whole fix, and they lift every other page too.
Something is blocking the paint: a stylesheet or synchronous script still loading in the <head> blocks rendering of everything after it, so the text sits in the DOM and does not appear. Inline what the first screen needs and defer the rest. This is the sub-part a text LCP fails on most.
The font has not arrived: a web font with a blocking period holds the paint until the file downloads or the period expires. The question here is narrow: how long will the browser wait before drawing anything at all? Preloading the one face used above the fold, with a font-display value that does not block, answers it.
One more case catches React and single-page applications. If the heading is assembled in JavaScript rather than served in the HTML, nothing paints until the bundle downloads, parses and runs, and no priority hint reaches that.
How do fetchpriority, preload and eager loading differ?
They act at three different moments, and confusing them is why teams add attributes that change nothing.
| Instrument | What it changes | When it does nothing |
|---|---|---|
fetchpriority="high" | Raises the priority of a request the browser has already found in the markup, so it competes better against everything else queued. | When the resource is not in the initial HTML. Priority is not discovery. |
<link rel="preload" as="image"> | Tells the browser the resource exists and to start fetching now, before the parser reaches the element that needs it. | When the resource was already discoverable in the initial HTML. You have added a tag and moved nothing. |
| Eager loading | Nothing. It is the default, and the browser fetches the image when it parses the tag. | Always, as an action. It matters only as something you must not switch off on the LCP element. |
web.dev's advice on the first is direct: set fetchpriority="high" on an <img> you believe is likely to be the page's LCP element. On a marketing page that is usually the hero, and the attribute costs nothing.
The mechanism underneath all three is the preload scanner, a lightweight pass that reads the raw HTML ahead of the main parser and starts fetching what it finds. It only finds what the markup contains. Two common patterns are invisible to it:
- A hero set as a CSS background image: the stylesheet has to download and apply before the browser knows the image exists. Preloading it in the HTML, or in a
Linkheader, is the documented way around that. - A hero inserted by JavaScript: an
<img>added by a script, or a carousel's first slide mounting on hydration, cannot be discovered until the script runs. Every millisecond of that wait lands in resource load delay.
In projects I've worked on the fix that actually moves the number is discovery far more often than priority, because a browser cannot prioritize a request it has not found. The markup for the common case is one line:
<img src="/hero.avif" width="1600" height="900" fetchpriority="high" alt="Product dashboard">
You rarely want both on the same resource. If the image is in the initial HTML the attribute is enough. Reach for <link rel="preload" as="image"> only when the resource is late-discovered, where it takes imagesrcset in place of href for a hero with multiple sources.
Why is your lab LCP better than your field LCP?
Because LCP is the one Core Web Vital a lab tool measures honestly, which is what makes a discrepancy worth reading. A Lighthouse run genuinely produces an LCP value, which it cannot do for INP and only partly manages for visual stability. What it does not produce is a real visitor. Three structural reasons, all pushing the same direction.
One connection profile, not a distribution: a lab run uses one emulated network and one emulated device. The Chrome User Experience Report gives you the 75th percentile of everything that actually loaded the page, and if your traffic skews toward mid-range Android on mobile data, that visitor is slower than the emulator by a margin no lab setting reproduces.
The lab loads the URL you typed: real visitors arrive through redirects, from ad clicks carrying tracking parameters, sometimes through a consent flow. Every extra hop is time to first byte your test never saw.
Some scripts only run for strangers: personalization, experimentation and tag-management logic often do nothing on an automated load, then compete with the hero for bandwidth on a first genuine visit.
So the field number is the verdict and the lab number is the explanation, and for LCP the lab is unusually good at the explaining half: it hands you the element and the sub-part split in one report. Diagnose in the lab, decide on the field. And note that CrUX reports on a trailing 28-day window, so a fix shipped last week has barely entered the average.
What are the most common LCP mistakes?
Four, and the first one accounts for most wasted effort.
- Optimizing an image when the element is text: the fix list for a text LCP has no image on it. Compressing the hero on a page whose largest element is a headline block cannot possibly change the number, and it stays the default action because compressing the hero is what an LCP ticket usually gets answered with.
- Compressing the file when the delay is in discovery: a resource load delay problem means the browser started late, not that the download was slow. Halving the file halves an already-small share of the total. Find out why the fetch began when it did instead.
- Preloading everything: priority is relative. A preload list six entries long says almost nothing about which resource matters, and it pulls bandwidth toward things the first screen does not need. Preload the LCP resource and be reluctant about the rest.
- Treating a clean Lighthouse score as a pass: a good lab number means the page is fast under conditions no visitor experiences. The field data decides, and it is the number Search Console reports.
Which sub-part is worth another sprint?
The one holding the largest share above its target, and nothing else. That is what the budget is for: it converts an argument about priorities into subtraction.
Read the budget against the targets and the case usually makes itself. Four ways it lands.
When the field number is inside 2.5 seconds: you have cleared a binary, and there is no credit above the line. Turning 2.1 seconds into 1.7 buys nothing a ranking system rewards. If a different vital is failing, that one is your work.
When the overage sits in resource load delay: usually the cheapest fix available, and rarely a sprint at all. An attribute, a preload tag, or moving an image out of a script is an afternoon.
When the overage sits in time to first byte: worth real engineering time, because it is the one sub-part that improves every page at once. It is also the most expensive to change, since it means caching strategy, hosting or the render path.
When the remaining fix is your rendering model: a text LCP blocked behind a client-side bundle is answered by changing how pages render, which is a quarter of engineering time rather than a ticket. Page experience acts as a tiebreaker between pages a reader would find equally useful. It does nothing for one that answers the query badly.
If the answer keeps coming back architectural, the diagnosis has become a build decision. If responsiveness is failing alongside loading, the same sub-part approach for INP takes that metric on its own terms.
The habit that pays for itself is small: never let an LCP ticket leave your hands without the element's name and the failing sub-part in it. A ticket that says "improve LCP" gets answered with image compression whatever is actually wrong. A ticket that says "LCP element is the h1, element render delay is 1.4 seconds of 2.9" gets answered correctly by whoever picks it up.
Take the page you would least like to lose, open it in Chrome DevTools, record a load, and write down two things: which element Chrome timed, and which sub-part holds the most milliseconds. If the element is not the one you expected, you have already avoided a sprint aimed at the wrong asset.
Audit the Site You Have Before You Build the Next One
GrowthHasten's Site Audit crawls your current website, groups repeated issues by template and names the pages each one affects, so you can see which problems a rebuild would actually solve and which a fix would. Free plan: one website of up to 900 pages, no card.
Analyze Your WebsiteQuestions
Frequently asked questions
How do I find my LCP element?
Three tools report it. PageSpeed Insights names the LCP element for one lab run in its Lighthouse diagnostics, with the sub-part breakdown underneath. The Chrome DevTools Performance panel gives you the node in the DOM after you record a page load. The web-vitals library, in its attribution build, is the only one that names the element your real visitors saw. Check mobile separately, because the viewport decides which element is largest.
What are the four sub-parts of LCP?
Time to first byte, resource load delay, resource load duration and element render delay. They run consecutively and sum to your LCP. web.dev publishes a target share for each: roughly 40 percent for time to first byte, under 10 percent for resource load delay, roughly 40 percent for resource load duration, and under 10 percent for element render delay. The usual culprit on a marketing page is resource load duration, an oversized hero, but a delay or render problem points somewhere structural instead.
Does fetchpriority="high" actually improve LCP?
It helps when the browser already knows about the resource and is fetching it too far down the queue, which is common for a hero image sitting in the initial HTML. web.dev recommends setting it on an image you believe is likely to be the LCP element. It does nothing when the resource is not in the markup yet, because raising the priority of a request the browser has not discovered is not possible. That case needs a preload tag or a change to how the image is inserted.
Can text be the LCP element?
Yes. Any block-level element containing text is an LCP candidate, so a large headline or a paragraph block can be the largest thing painted. When it is, the fix changes completely: there is no resource to fetch, so resource load delay and resource load duration are both zero and your whole budget is server response time plus element render delay. Work on time to first byte, render-blocking CSS and JavaScript, and the font that holds the first paint.
Should I preload my hero image?
Only when the browser cannot find it early on its own. The preload scanner reads the raw HTML ahead of the main parser, so an image written into the markup is already discovered and a preload tag adds nothing. Preloading earns its place when the hero is a CSS background image, is inserted by JavaScript, or sits in a carousel that mounts after hydration. Preload the one LCP resource and be reluctant about the rest, since priority is relative.
What is a good LCP score?
2.5 seconds or less, taken at the 75th percentile of real loads, with mobile and desktop scored apart from each other. Above 4.0 seconds is poor, and the band between the two needs improvement. The percentile matters as much as the number: your slowest quarter of visits sets the score, so the deciding visit comes from a slower device on a worse connection than the one you tested on. The verdict is CrUX field data, never a lab run.

Written by
GrowthHasten Team
Editorial Team, GrowthHasten
Articles from the GrowthHasten editorial team, grounded in primary research, our own testing, and what analyzing real websites shows, fact-checked in-house.
View profile