

Core Web Vitals are three metrics Google uses to measure the real-world experience of loading a page: how fast the main content appears, how quickly the page responds to input, and how much the layout shifts while it loads. This guide is for founders, marketers, and developers who want to understand what these numbers actually mean for search, and what to do about them. It covers each metric, what drags it down, and how to fix it, plus how to measure with field and lab data, and where a modern framework like Next.js earns its keep. Treat vitals as a tiebreaker that sharpens a solid page, not a lever that lifts a weak one.
The short version
- Core Web Vitals are a modest ranking signal and a tiebreaker between comparable results, not a shortcut past weak content or missing relevance.
- The three metrics and Google's documented "good" thresholds:
LCPat 2.5 seconds or less,INPat 200 milliseconds or less,CLSat 0.1 or less.INPreplaced First Input Delay in March 2024 and is stricter: it measures every interaction, not just the first.- Field data from real users decides your ranking eligibility. Lab data from Lighthouse only tells you why, in a controlled test.
- If your vitals are already in the "good" range, more micro-optimization rarely moves rankings. Spend that effort on content and links.
What are Core Web Vitals, and how much do they matter for SEO?
Core Web Vitals are three metrics that quantify page experience: loading speed, responsiveness, and visual stability. Google uses them as part of its page-experience signals, which act as a tiebreaker between results of similar relevance and quality rather than as a primary ranking force. They matter, but relevance, depth, and authority decide most rankings first.
That framing is easy to get wrong. A fast page with thin content will not outrank a slower page that answers the query better. Where vitals earn their weight is at the margin, when two pages are genuinely comparable and one loads cleanly on a mid-range phone while the other janks and jumps. Google's own Core Web Vitals reference on web.dev documents the thresholds and the reasoning behind them.
The three metrics, and the numbers Google publishes as the target for each:
| Metric | What it measures | Google's documented "good" threshold |
|---|---|---|
LCP (Largest Contentful Paint) | How fast the largest visible content element loads | 2.5 seconds or less |
INP (Interaction to Next Paint) | How quickly the page responds to user input | 200 milliseconds or less |
CLS (Cumulative Layout Shift) | How much visible content shifts unexpectedly while loading | 0.1 or less |
A page has to clear the threshold for all three at the 75th percentile of visits to count as passing. Two out of three is not a pass, and the 75th percentile means your slower quarter of visitors sets the score.
How do Core Web Vitals fit into page experience?
They are the measurable core of a broader set of page-experience signals that also includes HTTPS and mobile usability. Google folded the older, vaguer page-experience idea into these three numbers precisely because they can be measured on real devices, compared across sites, and improved with concrete engineering work.
The reason to care runs in two directions at once. Users abandon slow, unstable pages, so vitals map directly to bounce, engagement, and conversion regardless of search. Google then reads the same experience as one input among many. Fixing vitals is one of the few technical tasks that pays off for visitors and for rankings from the same effort. Our technical SEO guide places page experience in the wider crawl, render, and index picture.
What is Largest Contentful Paint, and what hurts it?
LCP measures how long it takes for the largest content element in the viewport, usually a hero image, a heading block, or a large text section, to finish rendering. Google's "good" threshold is 2.5 seconds or less. It is the metric most people mean when they say a page feels slow on arrival.
Three things cause most slow paints: a hero image that is oversized, in the wrong format, or lazy-loaded, a slow server response that starts every downstream step late, and render-blocking CSS and JavaScript in the critical path. Our guide to diagnosing and fixing Largest Contentful Paint covers which element the browser actually picks, the four sub-parts a slow paint breaks into, and what to change for each cause.
What is Interaction to Next Paint, and what did it replace?
INP measures how quickly a page responds visually after a user interacts with it, across the whole visit, and it replaced First Input Delay as a Core Web Vital in March 2024. Google's "good" threshold is 200 milliseconds or less. Where the old metric only timed the delay before the first interaction was processed, INP looks at every click, tap, and key press and reports the slowest meaningful one.
What hurts INP is almost always JavaScript: long tasks that occupy the main thread, oversized bundles, third-party tags, and event handlers that do too much work synchronously. Our guide to diagnosing and fixing Interaction to Next Paint breaks the metric into its input delay, processing, and presentation phases and covers how to find the slow interaction and what to change for each cause.
What is Cumulative Layout Shift, and what causes it?
CLS measures how much visible content moves around unexpectedly as the page loads, scored as a unitless number where lower is better. Google's "good" threshold is 0.1 or less. It is the metric behind the familiar frustration of reaching for a button and having an ad or banner shove it out from under your finger.
Three things cause most layout shift: media that loads without reserved dimensions, content injected above what the reader is already looking at, and web fonts that swap after first paint. Our guide to diagnosing and fixing cumulative layout shift covers how to find the element that is moving and what to change for each cause.
What is the difference between field data and lab data?
Field data is what real users experienced on real devices; lab data is what a single simulated visit measured in a controlled environment. This distinction matters more than any other in Core Web Vitals work, because only field data feeds the page-experience signal. Lab data explains why, it does not set your score.
Field data comes from the Chrome User Experience Report, or CrUX, which aggregates anonymized measurements from real Chrome users over a rolling 28-day window. That is the data Google uses to judge whether a page passes. Lab data comes from tools like Lighthouse that load the page once, on a defined device and connection, so you get a repeatable diagnostic you can run before anything is live.
| Aspect | Field data (CrUX) | Lab data (Lighthouse) |
|---|---|---|
| Source | Real Chrome users, aggregated | One simulated load in a controlled test |
| Best for | Judging whether a page actually passes | Diagnosing causes and testing fixes before launch |
| Limitation | Needs enough traffic; lags 28 days | Cannot capture INP, which needs real interaction |
One practical trap: INP cannot be measured properly in a lab, because it depends on real interactions that a single automated load never performs. Lighthouse estimates responsiveness, but your true INP only shows up in field data. Trust CrUX for the verdict, Lighthouse for the diagnosis.
How do you measure Core Web Vitals?
Start with PageSpeed Insights, which shows both field and lab data for a single URL in one view. Enter a URL and it reports CrUX field data at the top, when enough traffic exists, and a fresh Lighthouse run below it. That combination tells you both whether the page passes and what to fix if it does not.
For a site-wide view, Search Console has a Core Web Vitals report that groups URLs by status and metric, drawn from field data. It is the fastest way to see which templates are failing rather than checking pages one at a time. For local, repeatable testing during development, run Lighthouse from Chrome DevTools or the command line.
Which tool for which job: PageSpeed Insights for a single URL with both data types, Search Console for the whole site and for spotting failing patterns, and Lighthouse in DevTools for iterating on a fix before it ships. Google's Search Central documentation is the reference for how these signals are used in ranking.
How do modern frameworks like Next.js help with Core Web Vitals?
Modern frameworks bake many performance best practices into defaults, so you inherit good vitals rather than retrofitting them. The gains come from a handful of features that map neatly onto the three metrics, though every one of them still needs to be used correctly to deliver.
Image optimization
Components like next/image serve correctly sized, modern-format images with lazy loading and reserved dimensions by default. That attacks LCP and CLS at once: the hero loads faster and does not shift the layout when it arrives, though the component still needs a compressed, correctly sized source file, which our image SEO guide covers.
Code splitting and lazy loading
Frameworks split JavaScript per route and load components on demand, so a page ships only the code it needs. Smaller bundles mean shorter main-thread tasks, which is the direct lever for INP.
Rendering strategy
Server-side rendering and static generation send meaningful HTML on the first response instead of a blank shell that JavaScript has to fill, the same rendering call a headless CMS setup forces you to make on purpose once content and presentation are split. That improves how fast content appears and keeps your primary content in the server-rendered HTML, which helps crawlability too.
Font optimization and caching
Built-in font handling preloads and self-hosts fonts to limit layout shift, and framework caching plus a CDN cut server response time. The Next.js documentation covers each of these in detail.
A caveat worth stating plainly: a framework is a strong starting point, not a guarantee. Ship an unoptimized hero image or a dozen third-party tags and you will fail vitals on Next.js as easily as on anything else. The framework is only half the decision, too, since WordPress and Webflow can hit the same thresholds with the right setup, a trade-off our CMS comparison for SEO lays out platform by platform. If you are weighing a full redesign against a patch, our guide to redesigning without losing rankings walks through what to preserve.
What is a Core Web Vitals optimization checklist?
Work the checklist by metric, because each number has its own short list of high-leverage fixes. Start with whichever metric is failing in your field data, not with whatever is easiest to change. It slots into the broader sweep in our technical SEO checklist.
For LCP (loading). Compress and correctly size the largest image. Serve modern formats such as WebP or AVIF. Preload the LCP element. Add caching and a CDN to cut server response time. Inline critical CSS and defer render-blocking scripts.
For INP (responsiveness). Break up long JavaScript tasks. Defer and lazy-load non-critical scripts. Code-split so each page ships only what it needs. Audit and trim third-party tags. Move heavy work off the main thread where you can.
For CLS (stability). Set explicit width and height on all images and video. Reserve space for ads, embeds, and banners. Preload web fonts and control the swap behavior. Never insert content above what the user is already reading.
Across all three. Measure with field data first to find the real failure. Fix mobile before desktop, since Google indexes mobile-first and mobile hardware is slower. Our mobile SEO guide covers testing what Google actually sees on a phone. Re-check in PageSpeed Insights after each change, and remember CrUX lags 28 days, so field improvements take weeks to register.
When should you not chase Core Web Vitals?
When your vitals are already in the "good" range across all three metrics, stop optimizing and move on. Shaving an already-fast LCP from 1.8 seconds to 1.5 rarely changes a ranking, because vitals are a tiebreaker and you have already won that tie. The effort pays more if you redirect it to content quality, internal linking, or earning authority.
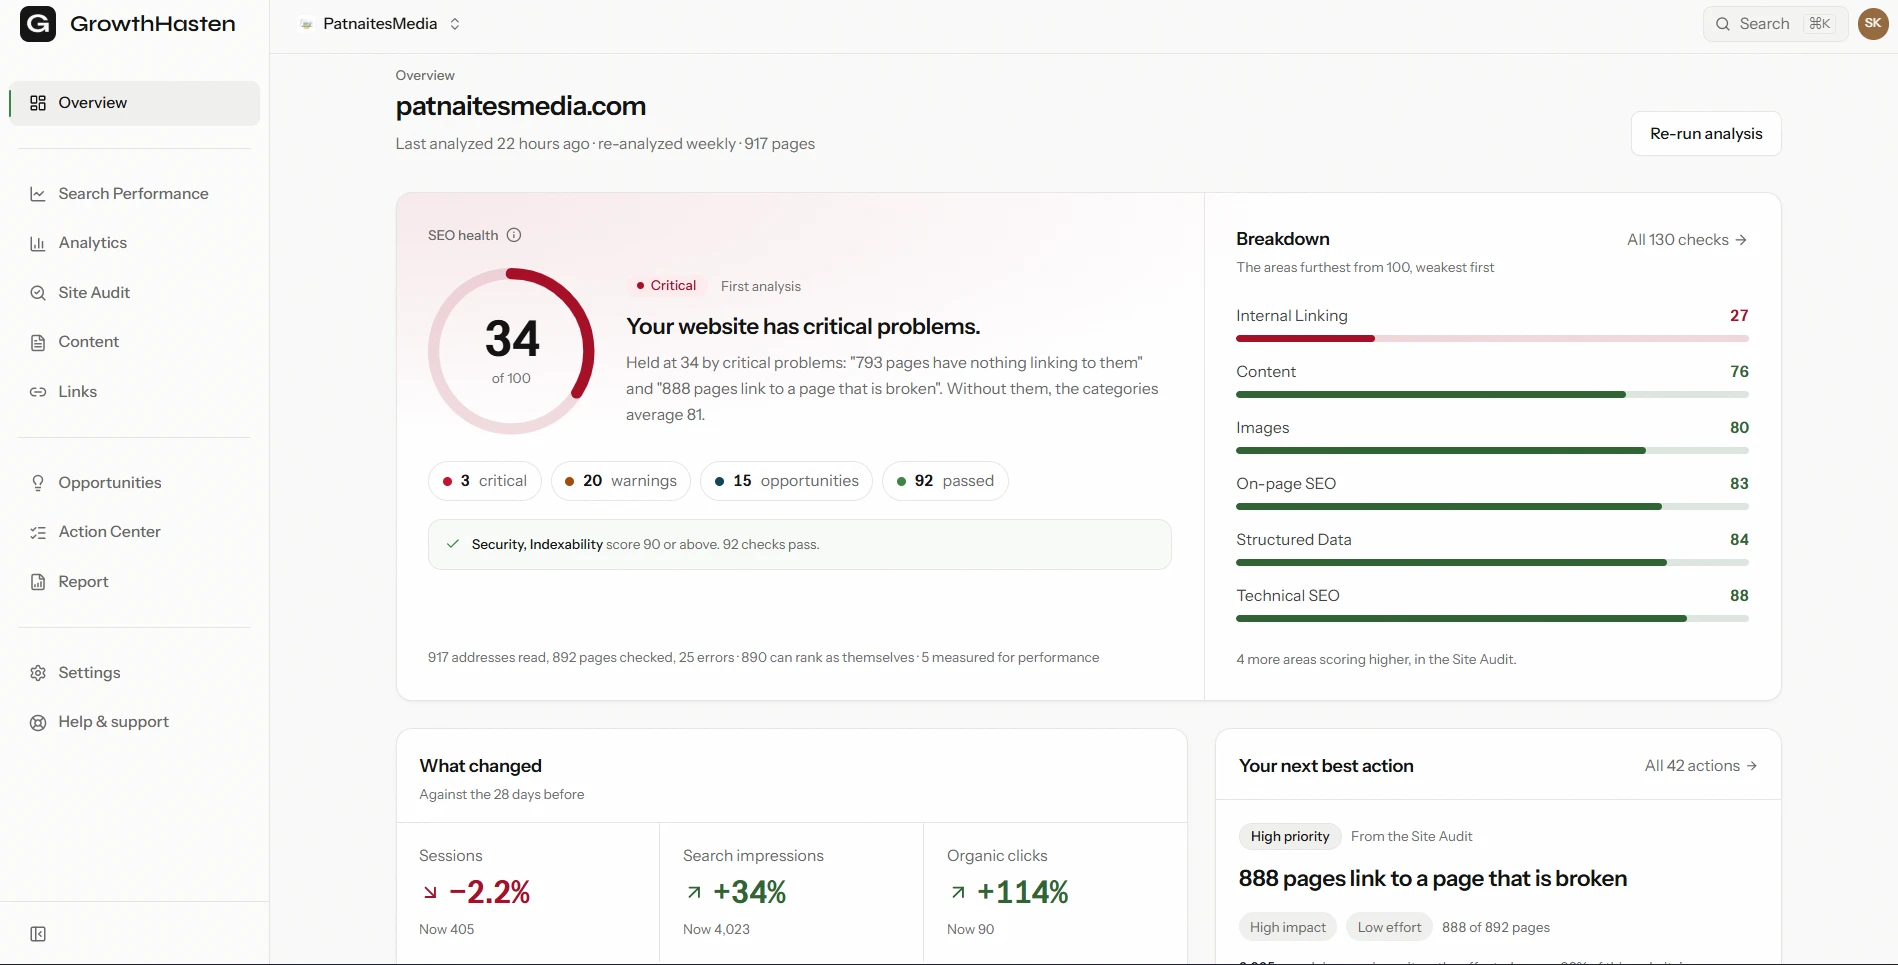
The same restraint applies when vitals are fine but rankings are stuck. A page sitting on the second results page with passing vitals does not have a performance problem, it has a relevance, depth, or authority problem, and no amount of speed work will fix that. Diagnose the actual bottleneck before spending a sprint on milliseconds. GrowthHasten's Site Audit weighs vitals measured from real Chrome visitors against every other finding, which is that diagnosis.
Chase vitals hard in one case: when field data shows a metric genuinely in the "poor" range and real users are feeling it. That is where the work moves both experience and rankings. Everywhere else, treat "good" as done.
Where should you start this week?
The habit worth building is a monthly check of the Search Console Core Web Vitals report, because performance decays quietly as pages accumulate scripts, images, and third-party tags one deployment at a time, which is exactly the kind of recurring line item that belongs in a website's maintenance budget rather than a surprise fix. Field data lags four weeks, so the sooner you look, the sooner you catch a regression before it has cost you anything.
This week, run your three most important pages through PageSpeed Insights and read the field data at the top, not just the lab score. If any of the three fails a metric, you have found your highest-priority fix, and the checklist above tells you exactly which levers to pull first.
Weigh Speed Against Everything Else on the List
GrowthHasten's Site Audit measures Core Web Vitals from real Chrome visitors over a sample of your pages and ranks performance findings alongside every other fix, so a slow page competes fairly for the sprint. Free plan, no card.
Explore the Site AuditQuestions
Frequently asked questions
What are the three Core Web Vitals?
The three Core Web Vitals are Largest Contentful Paint (LCP), which measures how fast the largest visible element loads; Interaction to Next Paint (INP), which measures how quickly the page responds to input; and Cumulative Layout Shift (CLS), which measures how much the layout moves unexpectedly. Together they capture loading speed, responsiveness, and visual stability, the three dimensions Google uses to describe real-world page experience.
What is a good Core Web Vitals score?
A page passes when it meets Google's documented good thresholds for all three metrics at the 75th percentile of visits: LCP of 2.5 seconds or less, INP of 200 milliseconds or less, and CLS of 0.1 or less. Two out of three is not a pass. The 75th percentile means your slowest quarter of visitors sets the score, so optimize for mid-range mobile rather than a fast laptop.
Do Core Web Vitals affect SEO rankings?
Yes, but as a modest signal and a tiebreaker rather than a primary ranking factor. Core Web Vitals are part of Google's page-experience signals, which can separate results of similar relevance and quality. They will not lift thin or irrelevant content above a stronger page. If your vitals are already in the good range, further optimization rarely moves rankings, so invest that effort in content and links instead.
What replaced First Input Delay in Core Web Vitals?
Interaction to Next Paint (INP) replaced First Input Delay (FID) as a Core Web Vital in March 2024. FID only measured the delay before the browser processed the first interaction on a page. INP is stricter: it measures responsiveness across every interaction during the visit and reports the slowest meaningful one. Because it captures the whole experience rather than just the first tap, INP is harder to game and reflects how a page actually feels.
Why do my Core Web Vitals differ between PageSpeed Insights and Search Console?
Because they draw on different data. PageSpeed Insights shows both field data from real users and a fresh lab test, while Search Console reports only field data from the Chrome User Experience Report. Field data reflects real devices and connections and is what Google uses for rankings; lab data is a single controlled load useful for diagnosis. Field data also lags on a rolling 28-day window, so recent fixes take weeks to appear.

Written by
GrowthHasten Team
Editorial Team, GrowthHasten
Articles from the GrowthHasten editorial team, grounded in primary research, our own testing, and what analyzing real websites shows, fact-checked in-house.
View profile